
Nature Needs a Balance Sheet
Society is getting better at valuing nature. But we still don't know how to make sense of the overall numbers. Could financial statement accounting be the answer?

1. Headline
In early 2025, the firm Zero Carbon Analytics released its estimate of the value of nature, based on previous work completed by Boston Consulting Group (BCG) in 2021. The number? $179 trillion…well above the value of the world’s global economy. Additional research shows that human beings are steadily eroding nature’s value each and every year. What can we do? For starters, we believe that it is important to better communicate what nature does for specific industries, countries, and their people. We therefore aim to mimic the business world and its presentation of financial statements by fashioning Zero Carbon Analytics’ nature valuation into a balance sheet, replete with follow-on detail as to how a proper accounting for nature degradation might impact the American corn farmer’s income statement. The results show that we’re running out of time…and that we can’t afford to continue on our current path.
2. What does this mean?
Over the past 40 years, human beings have increasingly worked to better understand the economic value of nature and the services that it brings to bear for society. These “ecosystem services” include production of the oxygen that we breathe alongside inputs for the food that we eat, the medicine that we use, and the clothes that we wear, among many other functions. The important work to assign a value to these ecosystem services is largely agreed to have started with Costanza et al and their seminal paper published in the journal, Nature, in 1997, whereby an initial value of $33 trillion was assigned to the natural world at that time. Many updates have since occurred, with one of the more recent estimates coming from Zero Carbon Analytics in early 2025, based on work completed by Boston Consulting Group (BCG) in 2021. This most recent estimate assigns a global value of $179 trillion to nature.
As we discuss ahead, the valuation of nature has become better understood and more detailed over time. This is a welcomed development. However, the consideration of these values in absolute terms leaves society with little actionable intelligence, in our view. What does $179 trillion even mean? How does the public comprehend such a value? It is our opinion that human beings do a poor job of analyzing absolute figures on their own. However, we do a great job of analyzing relative data. Humans love to compare one thing with another. It is how we make sense of the world around us. Thus, if we’re going to endeavor to protect nature, we need to find a better way to communicate its value. This got us thinking about the role of financial statements in the business world.
In many countries around the globe, governments mandate that companies maintain records of their financial results in order to establish a proper accounting of tax receipts, while also aiming to protect market participants involved in deploying capital across the business landscape. In turn, investors and other stakeholders are able to use these financial statements for the purposes of investment decision-making. In the United States, companies are bound by the Generally Accepted Accounting Principles (GAAP) mandated by the Securities & Exchange Commission (SEC) and set by the Financial Accounting Standard Board (FASB). The GAAP framework — and the International Financial Reporting Standards (IFRS) used in other markets — allows for standardized comprehensive reporting of financial statements like the balance sheet, income statement, and cash flow statement, each of which properly account for assets, liabilities, and equity (balance sheet); revenue, costs, and profit (income statement); and the cash position (cash flow statement) of a business. In this way, all stakeholders can properly track financial results over time, while also comparing relative performance against other entities in the marketplace.
If money rules the world, then financial accounting and reporting is society’s primary method for keeping track of our progress. Thus, why can’t we take the same approach with nature? We already have a total value for nature’s ecosystem services. How can we fashion this into financial statements that might offer improved intelligence for action?
To start, we have created a balance sheet for nature using the $179 trillion value from Zero Carbon Analytics based on the prior work of BCG. This ecosystem services value represents the “assets” side of the ledger, with the total figure broken down into four primary ecosystem service classifications offered by the natural world:
Regulating - systems that control and stabilize Earth’s environment
Cultural - services that offer recreation, inspiration, and spiritual value
Habitat/Supporting - processes that sustain life ecosystems
Provisioning - production of tangible goods for use
To go a step further, we analyzed “division-level” data from research published by de Groot et al in 2012 in order to better understand how these four primary ecosystem services break down according to life-sustaining service and/or economic contribution. In their article in Elsevier, de Groot et al present values like Avoided Cost Factors, Market Value Factors, and Preference data that allow us to estimate the value of specific ecosystem services made available to society within each primary classification. See directly below.
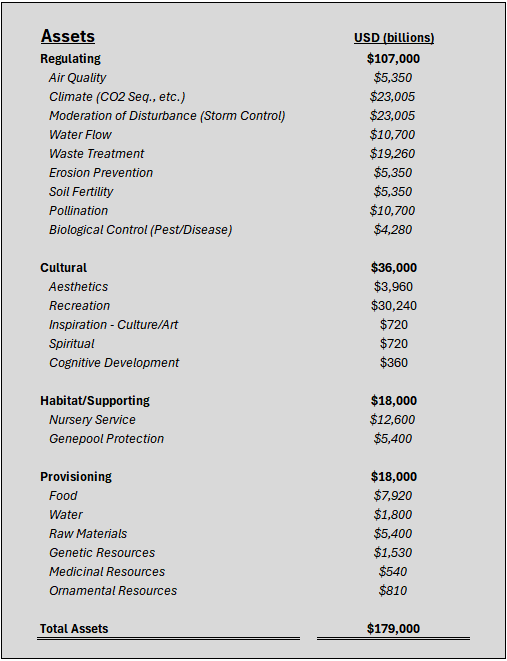
As shown above, the Regulating ecosystem services provided by nature are far and away the most valuable of all four primary classifications. The associated $107 trillion value is led by the environment’s ability to sequester carbon, keep hurricanes and other storms in check, properly remove waste, cycle water, and pollinate crops. Cultural benefits are the second largest primary service provided by nature, led predominantly by the value that human beings receive from recreational opportunities. Thereafter, Habitat/Supporting and Provisioning services are each estimated at a similar value, with Provisioning services offering the food, water, energy, and medicine that humans consume, among other items of tangible necessity.
For the “liabilities & equity” side of the ledger, we desired to find a dataset that could appropriately match society’s reliance on the ecosystem services provided by nature as an asset base. Ultimately, we decided that Gross National Product (GNP) of all the world’s countries was the best option for the “liabilities” section of nature’s balance sheet. In our view, it is the world’s political classifications and the companies and individuals that operate under their flags that draw the most direct impacts on the natural world. Thus, we believe that this analysis is best served by accounting for the GNPs of each country as the main liability against nature’s ecosystem services. As shown below, the United States currently holds the largest liability against nature, representing 26% of global GNP as of 2024. China holds the next largest liability at 17%. It is an important matter of fact to acknowledge that the economies of the U.S., China, and all other countries of the world are wholly reliant on nature for their economic output and its measured value.
[For additional detail on this subject, we advise readers to access World Wide Fund for Nature’s (WWF) Risk Filter maps on select ecosystem services]
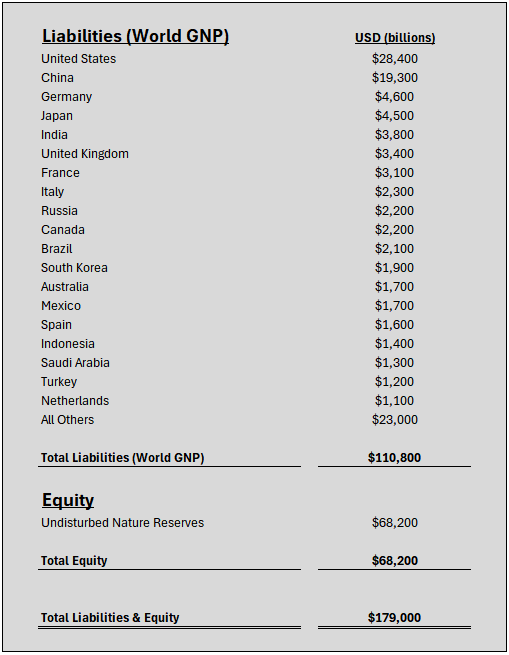
One of the more interesting results of presenting nature’s balance sheet in this form is that related to the “equity” line. What exactly does this figure represent? After accounting for all of the value that is created by the world’s economy ($110.8 trillion) and then comparing this to nature’s ecosystem services value of $179 trillion, we are left with a positive buffer of $68.2 trillion. We believe that this represents undisturbed nature reserves not yet touched by global industry. However, just like all corporate balance sheets, the rule holds true that if there is a decline in value on the assets side of the ledger, that means that a corresponding decline will need to take place on the liabilities & equity side of the ledger. What is the risk here?
Zero Carbon Analytics estimates that the world’s natural ecosystems have experienced a 47% decrease against their estimated baselines, as of 2019. In other words, the pre-industrial natural world likely held latent value of $337.7 trillion before mankind started aggressively adapting nature for the purposes of an extractive economy. Society has therefore “consumed” $158.7 trillion of nature’s $337.7 trillion value. What happens when we use all 100%?
The Economics of Land Degradation Initiative (ELD) estimates that $6.3 to $10.6 trillion of ecosystem services value is being lost annually due to negative human impacts on the land. This means that total annual losses — inclusive of ocean and atmospheric impacts — is above this range, with some believing that the total number approaches losses of $25 trillion annually. For its part, the World Bank says that negative impacts to nature could filter down into the global economy and start removing $2.7 trillion in Gross Domestic Product (GDP) annually by 2030. This estimate of GDP starting to feel a negative impact by 2030 makes rough sense when considering our current natural world “equity” reserves of $68.2 trillion.
How can we use this information to act and protect nature? An example from the food & agriculture space should prove instructive. In this instance, we attempt to analyze the American corn farmer’s underlying impact on nature, along with how a proper accounting of this impact might change the dynamics of his personal income statement (revenue, costs, and profit).
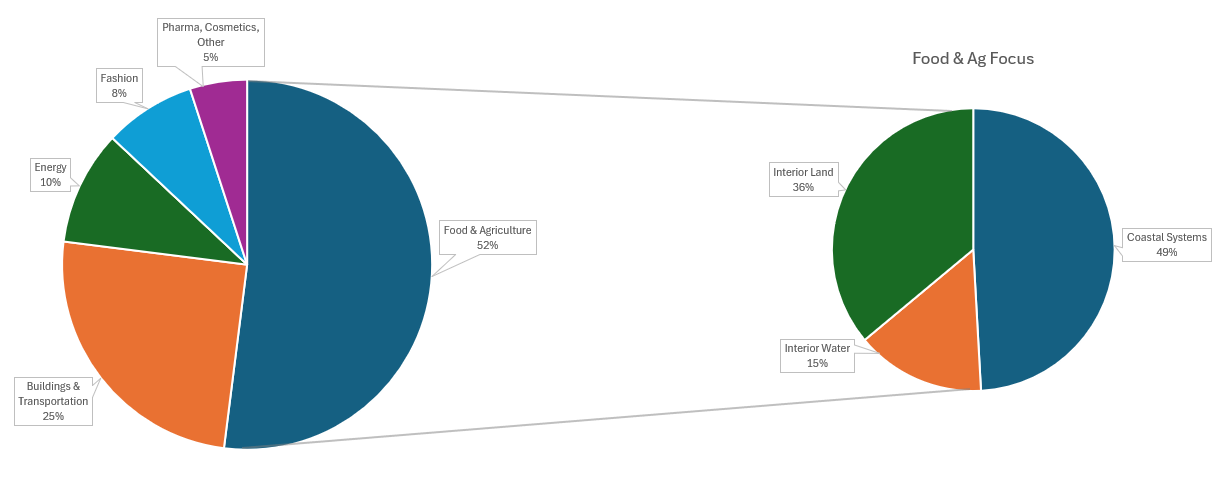
From an industry standpoint, the biggest aggressor against nature is the global food & agriculture industry, according to data from Boston Consulting Group (BCG) that estimates share of total global pressure on biodiversity / nature.
Food & Agriculture - 52% share
Buildings & Transportation - 25% share
Energy - 10% share
Fashion - 8% share
Pharma, Cosmetics, Other - 5% share
Within the Food & Agriculture segment itself, we again use data from de Groot et al (2012) to estimate the underlying segments within the industry that have the largest impacts on nature. As shown below, we believe that coastal systems represent almost half of food & agriculture pressures on nature, followed by interior land-related pressures at 36% of the category, followed by interior water-related pressures at 15%.
If we assume that ~$15 trillion of total annual ecosystem service losses are now taking place around the world, this means that the food & agriculture industry is theoretically responsible for removing $7.8 trillion ($15 trillion x 52%) of this value every year. Within food & agriculture, interior land operations make up 36% of the sector’s impact, according to our calculations. This means that interior farms around the world are directly responsible for removing $2.8 trillion ($7.8 trillion x 36%) in value each year, if not more. The United States represents ~26% of global GNP as of 2024. Thus, interior farmers in the U.S. could potentially be contributing to annual ecosystem service losses of $730 billion ($2.8 trillion x 26%) each year1. Corn was planted on 98.8 million acres of American farmland in 2025, representing 11% of total U.S. farm area for the year. Therefore, U.S. corn farmers could be contributing to $80.3 billion worth ($730 billion x 11%) of ecosystem service losses annually. According to the 2022 Agriculture Census, roughly 18% of American farms are grain & oilseed operations (corn/bean rotations). Today, there are approximately 1.88 million farms in the U.S. This means that corn is grown on roughly 338,000 farms (1.88 million x 18%) in any given year in the United States. If we divide $80.3 billion by 338,000, we calculate an average ecosystem service hit of $237,574 per U.S. corn farm per year. Given that the average farm size in the U.S. is 466 acres, this means that the average American corn farmer is theoretically contributing to just over $500/acre in ecosystem service losses each year. What does this mean in terms of the farmer’s annual income statement / profit & loss position?
In short, the average U.S. corn farmer would go from eking out a gain of $21/acre in 2025 to losing $489/acre if he was made to account for his theoretical contributions to the degradation of nature, as shown in the illustrative income statement comparison below.
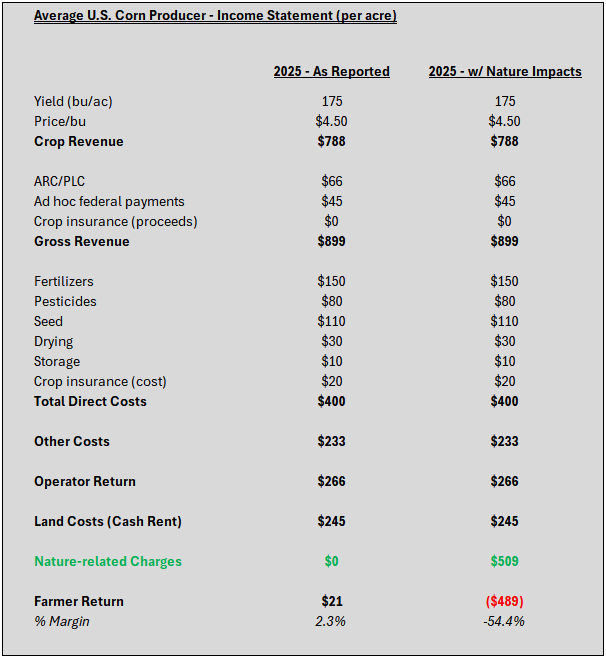
Is this fair to make the individual farmer recognize such a charge within his own personal operations? This topic presents some thorny issues. As a baseline, no individual farmer would be able to recognize a ~$500/acre nature charge on his own profit and loss statement without being in the red and going out of business (note that the American corn farmer’s 2025 profit was only made possible by government subsidies via ARC/PLC and trade-related bailout assistance). However, a nature charge like the one above is indeed a very real non-cash expense item that is instead being born by the rest of society. We need to account for this in some way.
For a moment, consider the corollary of how farmers pay money up front for tractors and other machines, only to depreciate the cost of these assets over time by recognizing a portion of the cost each year on their own income statements. Depreciation accounting states that eventually a tractor or other piece of equipment will break down and, therefore, it is appropriate to account for a consistent portion of its cost while the asset is in production.
In the case of ecosystem services from nature, the ~$500/acre cost is a very real cost whereby the ongoing production of corn is degrading nature’s ability to produce those same products and, thus, contribute to economic output over time. However, this particular cost is shared by all of society (the farmer only produces grain because consumers demand food). If we don’t find an appropriate way to account for this cost, society will keep unknowingly degrading nature, reducing the value of assets (ecosystem services) on our balance sheet above and, in turn, eventually reducing liabilities (GNP output) and/or our buffer of untouched nature (equity). Ultimately, the argument could be made that society might imperil nature so much that large cascading declines could impact nature’s ability to function and thus sustain life let alone the global economy.
In the end, the world must find a way to pay farmers and other direct users of nature in an amount that mirrors the implied cost that should now be carried on their income statement accounts. Similar to carbon markets, a nascent industry of biodiversity/nature credits is starting to develop (voluntary biodiversity credits, or VBCs), offering some hope that society is beginning to better understand nature’s financial accounts. Without this intervention, it is likely that the world will further degrade our remaining stores of nature before then cutting into global economic output. Such a reality isn’t far off.
3. Key takeaway
The valuation of nature has seen steady improvements in recent decades, culminating with a recent analysis by Zero Carbon Analytics that pegs nature’s “ecosystem services” at $179 trillion, based on work completed by Boston Consulting Group (BCG) in 2021. Still, it’s hard to make sense of the meaning behind such a figure. We believe that society needs to start fashioning the natural world’s value into financial statements like a balance sheet or income statement that might be more easily consumed by a multiplicity of stakeholders. Countries need to know their direct impacts on nature - as do individuals and entities operating across the economy. With hope, the development and acceptance of voluntary biodiversity credits (VBCs) will create market incentives to reverse our ongoing annual degradation of the environment and support business, livelihoods, and life.
4. Where to find us
Check us out on our homepage or come connect with us on LinkedIn.
We’re an investment fund that raises money from long-term investors to pay farmers and landowners to plant trees on their properties alongside crops and/or animals, returning nutrients to the soil and our food while delivering attractive, uncorrelated returns to investors.
We should be using gross domestic product (GDP) in this particular instance, relative to gross national product (GNP), however we stay with GNP in order to remain consistent in this article. GNP and GDP are relatively close in size, and we therefore believe that GNP is still appropriate for the purposes of our hypothetical analysis presented in this section.